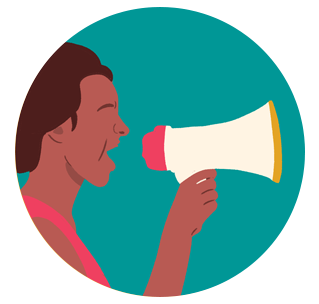
In September 2016, the 13th AWID international Forum brought together in Brazil over 1800 feminists and women’s rights advocates in a spirit of resistance and resilience.
This section highlights the gains, learnings and resources that came out of our rich conversations. We invite you to explore, share and comment!
What has happened since 2016?
One of the key takeaways from the 2016 Forum was the need to broaden and deepen our cross-movement work to address rising fascisms, fundamentalisms, corporate greed and climate change.
With this in mind, we have been working with multiple allies to grow these seeds of resistance:
Movements can also benefit from new methodologies on Visioning Feminist Futures (Coming up soon!)
And through our next strategic plan and Forum process, we are committed to keep developing ideas and deepen the learnings ignited at the 2016 Forum.
What happens now?
The world is a much different place than it was a year ago, and it will continue to change.
The next AWID Forum will take place in the Asia Pacific region (exact location and dates to be announced in 2018).
We look forward to you joining us!
About the AWID Forum
AWID Forums started in 1983, in Washington DC. Since then, the event has grown to become many things to many peoples: an iterative process of sharpening our analyses, vision and actions; a watershed moment that reinvigorates participants’ feminisms and energizes their organizing; and a political home for women human rights defenders to find sanctuary and solidarity.
Née en 1936 dans le Maryland aux États-Unis, Sue était artiste, activiste et enseignante.
Son art était destiné aux femmes et parlait des femmes. En tant que féministe lesbienne, pendant un temps séparatiste, elle s'est engagée à créer des espaces réservés aux femmes. En 1976, elle a acheté un terrain qui est toujours géré par des femmes qui y séjournent pour créer de l'art. Sue a pris une position farouche sur la question de la protection des femmes et des filles.
Avec son approche révolutionnaire, futuriste et anthropologique, elle remplissait chaque pièce dans laquelle elle entrait avec une intelligence et une excentricité authentiques, ainsi qu’un humour et un esprit impitoyable. Ses idées sur la conscience et la créativité continuent à inspirer beaucoup de gens.
When we are desperate for change, as we are both in illness and insurrection, our language drains of complexity, becomes honed to its barest essentials... As illness and revolution persist, though, the language made in them and about them deepens, lets in more nuance, absorbed in the acutely human experience of encountering one’s limits at the site of the world’s end. Johanna Hedva
When we began scheming for such an issue with Nana Darkoa, ahead of AWID’s Crear | Résister | Transform: a festival for feminist movements!, we departed from a question that is more of an observation of the state of the world – a desire to shift ground: why do our sexualities and pleasures continue to be tamed and criminalized even as we are told, over and over again, that they bring neither value nor progress? We came to the conclusion that when they are embodied, something about our sexualities works against a world order that continues to manifest itself in border controls, vaccine apartheids, settler colonialism, ethnic cleansing, and rampant capitalism. Could we speak, then, of the disruptive potential of our sexualities? Could we still do that when, in order to be resourced, our movements are co-opted and institutionalized.
When our embodied labor becomes profit in the hands of the systems we seek to dismantle, it is no wonder that our sexualities and pleasures are once again relegated to the sidelines – especially when they are not profitable enough. In many instances during the production of this issue, we asked ourselves what would happen if we refused to accommodate the essential services of capitalism. But can we dare ask that question when we are exhausted by the world? Perhaps our sexualities are so easily dismissed because they are not seen as forms of care. Perhaps what we need is to reimagine pleasure as a form of radical care – one that is also anti-capitalist and anti-institutional.
As we enter our second full year of a global pandemic, our approach to transnational embodiments has had to focus on a single political realization: that taking care is a form of embodiment. And because right now so much of our work is being done without consideration for the borders between and within ourselves, we are all Transnationally Embodied – and we are all failing. We are failing to take care of ourselves and more critically, to take care of each other.
This failure is not of our own making.
Many of our parents thought of labor as transactional, something to be given in exchange for compensation and a guarantee of care. And while that exchange was not always honored, our parents did not expect that their work would provide them fulfillment. They had their leisure, their hobbies, and their communities for that. Today, we their children, who have been conditioned to think of our labor as intertwined with our passion, have no such expectations. We think of work and leisure as one and the same. For too many of us, work has come to embody our whole selves.
However, heteropatriarchal capitalism doesn’t value us, let alone our labor or our sexualities. This is a system that will only demand more and more until you die. And when you die, it will replace you with somebody else. Expectations to be online round the clock mean we simply can’t get away from work, even when we want to. This commercialization of labor, divorcing it from the person, has infiltrated every aspect of our lives and is being perpetuated even in the most feminist, the most radical and revolutionary circles.
Capitalist expectations have always been particularly pernicious to bodies who don’t fit its ideal. And those seeking to consolidate their powers have used the pandemic as an opportunity to target women, sexual minorities, and any others that they see as less than.
This special issue exists because of, and certainly in spite of this.
Almost every contributor and staff member was pushing themselves past their capacity. Every single piece was produced from a place of passion, but also incredible burnout. In a very real way, this issue is an embodiment of transnational labor – and in the digital world we live in, all labor has become transnational labor. As we have to contend with new borders that do not break an old order but reify it, we experienced firsthand, alongside our contributors, how capitalism drains our limits – how it becomes difficult to construct cohesive arguments, especially when these come with a deadline. We collectively became lost for words – because we are lost for worlds.
Feeling lost and alone in the world of heteropatriarchal capitalism is exactly why we need to re-evaluate and rethink our systems of care. In many ways, we turned this issue into a mission of finding pleasure in care. Because it has become more difficult to construct cohesive arguments, visual and creative mediums have come to the forefront. Many who used to write have turned to these mediums as ways to produce knowledge and cut through the mental fog that’s enveloped us all. We brought into the issue other voices, in addition to many whom you heard at the festival, as a way of opening up new conversations, and extending our horizons.
As we are robbed of our words, it is our political duty to continue to find ways to maintain and care for ourselves and each other. So much of our current realities are trying to erase and displace us, while still exploiting our labor. Our embodiment, therefore, becomes a form of resistance; it is the beginning of us finding our way out and into ourselves.
Lara was a well-known and loved radio DJ on Motsweding FM in South Africa.
Lara was one of the first openly-transgender radio hosts on a mainstream station. She worked hard to shine a light on LGBTI issues.
Lara’s activism started at a young age when she would vocally defend her right to dress and behave as she felt comfortable to members of her community who didn’t yet understand what it meant to be transgender.
Snippet FEA Story 1 Maps Economies of Care (EN)
FRMag - My queer Ramadan
My Queer Ramadan
by Amal Amer
I pray with my family for the first time in six years while wrapped in a keffiyah I scavenged from a dumpster. (...)
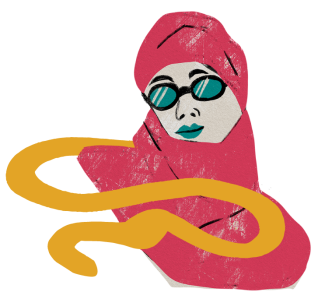
artwork: “Angels go out at night too” by Chloé Luu >
Un gozo para el mundo: Seis preguntas a Naïké Ledan
Entrevista realizada por Chinelo Onwualu
Naike Ledan es una defensora de la justicia social, una feminista comprometida y con 20 años de experiencia en la defensa de los derechos humanos y la justicia social, el empoderamiento de las mujeres, la lucha por el acceso universal a los servicios básicos y la inclusión social, así como por el desarrollo de las capacidades de la sociedad civil. Tiene una vasta trayectoria de trabajo en Canadá, en África occidental y meridional, y en Haití, en la promoción de los derechos civiles, el desarrollo de las capacidades de las organizaciones de la sociedad civil, enfocada sobre todo en los determinantes sociales de la exclusión estructural. Valora los principios de un liderazgo compartido, anticolonial, contra la opresión y los espacios antipatriarcales.
Chinelo Se te conoce como activista por los derechos trans; me intriga cómo fue tu recorrido hasta allí.
Naike Crecí en Haití donde viví hasta los 18 años y luego me fui a vivir a Montreal donde pasé 19 años. Cuando volví a Haití, en 2016, pensaba que estaba regresando a casa pero el lugar había cambiado y tuve que readaptarme. No volví a conectarme como había esperado hacerlo con la familia y las amistades de mi infancia. Volví habiendo vivido en el exterior, con una situación laboral cómoda y durante mucho tiempo me sentí bastante extranjera. Y a la vez me sentía muy en casa por el idioma, los silencios entendidos, no tener que explicar nada cuando empezamos a cantar un anuncio publicitario. Ya sabes: esas cosas que compartimos, esa energía, ese espacio, ese espíritu.
Cuando volví a amarme a mí mismx – yo lo llamaría «renacimiento» – que coincidió con parir a mi primerx hije, parirme a mí mismx y enamorarme de mi ser queer o alguien que ama a personas de su mismo género. (Créditos: Naïké Ledan)
Lo que me ayudó fue que me gustó mucho la tarea de andar por el país y documentar lo que la gente sabía. Entonces, dejé la comodidad de lado. Me convertí en directora nacional de una organización regional que era completamente queer. Mi trabajo consistía sobre todo en conseguir recursos y desarrollar capacidades en la sociedad civil. Mi estrategia era salir a las zonas rurales, buscar a todas las organizaciones pequeñas que había ahí, ayudarlas a desarrollar su capacidad y financiarlas. No me interesaban lxs polítiquxs, ni andar a los apretones de manos o sacarme fotos (risas). Tuve un muy buen aliado: Charlot Jeudy, el activista (queer) que fue asesinado hace tres años en su casa. Nos acercamos mucho después de que se prohibió en Haití un festival de cine afro-queer que habíamos planeado juntxs. La prohibición hizo mucho ruido y logró que se hablara de ser queer en todas partes, entonces Charlot me presentó a todas las OSC pequeñitas que había en cada rincón del país. Y ahí estaba yo para ayudarlas a registrarse o a elaborar sus planes estratégicos. Fue esa clase de trabajo la que me convirtió en activista queer y, por extensión, en activista trans. Aunque yo no me defino como activista. Es una palabra con mucho peso, ¿no crees? Es algo que otrxs dicen de ti. Yo creo que solo soy amante y luchadorx (risas).
Chinelo Cuéntame sobre el taller que facilitaste durante el Festival de AWID. ¿De qué se trataba y en qué contexto surgió?
Mi profunda conciencia de mí mismx en la infancia y cómo ya cuestionaba las desigualdades e injusticias a muy temprana edad (+/- 4 años de edad). (Créditos: Naïké Ledan)
Naike Los medios internacionales no hablan en serio sobre Haití, pero en un ambiente político tan malo como el que estamos viviendo, el ambiente económico se torna aún más catastrófico. Como haitianx más bien de clase media, que habla otros idiomas, que tiene otros pasaportes, al principio dudé de si yo debía ocupar ese espacio o no. Pero muchas veces me veo como un puente más que como alguien que va a hablar de sí mismx. Entonces decidí invitar a Semi, una joven mujer trans brillante que vive fuera de Puerto Príncipe, para que tomara el espacio y la palabra, y nos trazara un recorrido sobre el ecosistema de las realidades que viven las mujeres trans en Haití. Terminamos creando una sesión sobre el feminismo que no incluye — o, diría yo, los espacios feministas formales (que no lo hacen) — y cómo en Haití las chicas trans no cuentan con espacios donde puedan contribuir al conocimiento de las mujeres y compartir sus realidades. Por eso el Festival de AWID me dio la oportunidad de ceder el espacio a las mujeres que deben ocuparlo. Lo pasamos muy bien, tomamos vino en línea mientras charlábamos. Mi cofacilitadora, Semi, contó cómo fue haber sido unx niñx/niña/mujer trans en distintas etapas de su vida. También habló de los peligros de la calle, de la pobreza, la exclusión, lo que ocurre cuando «se te nota», así como de sus victorias.
Chinelo ¿Qué relación existe en Haití entre las mujeres trans y las organizaciones feministas? ¿Cómo ha sido tu experiencia en este sentido?
Naike La experiencia de las mujeres trans en Haití ha sido realmente difícil; devastadora en realidad. Pasaron de la invisibilidad absoluta a estar extremadamente sexualizadas. Otra cosa que sucede es que las están matando y los medios no informan acerca de esos asesinatos. Así de inexistentes, de borradas son y están las mujeres trans. Están en todas partes pero no en los espacios laborales, ni en los espacios feministas ni en las organizaciones. Ni siquiera en las organizaciones LGBT. Solo muy recientemente, y gracias a mucha presión del activismo, algunas de estas organizaciones de alguna manera se están readaptando, pero en los espacios feministas esto sigue estando fuera de toda consideración. Todavía tenemos que escuchar el viejo discurso excluyente que dice «No son mujeres. Por supuesto, si no se les nota … » La cultura de que no se note es una conversación sobre gestión de riesgos: cuánto se te nota y cuánto no se te nota, y lo que eso implica para tu cuerpo y en términos de la violencia que causa. En las realidades trans-excluyentes que vivimos, que se reproducen en muchos espacios feministas, a las que no «se les nota» en absoluto tal vez se las considere chicas, pero solo hasta cierto punto. Pero, ¿qué pasa cuando se enamoran, cuando quieren conversar, cuando están en el armario, cuando quieren adoptar una determinada estética o seguir una carrera? La conversación sobre la terapia hormonal termina centrándose en la reducción de riesgos, como lo dijo la propia Semi en el taller. Pero no tenemos la opción de las terapias hormonales, no tenemos ni el marco médico ni un sistema que apoye a las que quieran tomar por ese camino.
Chinelo Cuando hablas de lo que piensa la sociedad acerca de las personas trans y las personas queer, suena bastante similar a lo que ocurre en Nigeria que puede ser un ambiente profundamente homofóbico.
Naike Haití es un país muy complejo de maneras muy hermosas. Aquí nada es simple, ¿sabes?, las cosas nunca son de una sola forma. La gente es muy tolerante, y también muy homofóbica. Hay zonas rurales en las que la gente no es para nada homofóbica porque allí hay muchos templos vudús y esa es una religión que respeta la vida. Un principio básico de la religión vudú es que todxs lxs niñxs son niñxs. Por eso es una religión que no define lo que está bien ni lo que está mal. Durante muchísimo tiempo la gente pensó en Haití como un refugio, un lugar donde había tolerancia — estamos hablando de los setenta, ochenta, antes del VIH, inclusive los noventa. Luego vino el terremoto (en 2010) donde murieron casi 300 000 personas. Y entonces llegó todo ese dinero de las iglesias evangélicas del sur de Estados Unidos para reconstruir el país y encontrar a Jesús. Por eso la homofobia en Haití es algo muy reciente. En lo profundo, en el corazón del alma de su cultura, no puedo realmente decir que sea un país homofóbico. Pero en la vida cotidiana no hay duda de que esa violencia lastima la piel de las personas queer. Y de las mujeres, de las mujeres empobrecidas, las mujeres de piel oscura, porque el colorismo está muy arraigado en el Caribe.
Chinelo ¿Cómo te has enfrentado a esto? ¿Cuál ha sido tu estrategia para sobrevivir?
Mi regreso a Haití como parte de mi proceso de descolonización y la elección de posicionar físicamente mis sentidos y los de mi familia de manera inflexible del lado de la magia y la negritud. (Créditos: Naïké Ledan)
NaikeEstoy enamoradx de mi trabajo. Me encanta trabajar. Cuando recién llegué trabajaba en una ONG horrible pero el trabajo que hacía era maravilloso. Estaba siempre en zonas rurales, conversando y aprendiendo de la gente, de las mujeres. Y eso me colmó el corazón durante mucho tiempo porque adoro mi cultura, a la gente negra, a las mujeres negras, a las ancianas negras, lxs bebés negrxs. Es algo que me colma espiritualmente. Cuando vivíamos en Canadá, mis hijxs iban a esas escuelas sólo de blanquxs donde lxs trataban como mascotas. No hablaban creole ni francés. Y ahora corren libres por el jardín y ya están empezando a pelearse en creole. También encontré espacios de supervivencia en la gente a la que conocí. Forjé lazos con gente queer y con otra gente rara como yo, y eso ha sido realmente maravilloso. Pero ahora todo se ha vuelto más difícil porque ya no me siento segurx en Haití. En Puerto Príncipe ocurren casi 40 secuestros por semana, y esto es así desde 2018. Ahora tengo ataques de ansiedad y de pánico. Entonces, es hora de irme y he comenzado a preguntarme dónde está mi hogar. Pasé 19 años en Montreal pero allí nunca sentí que estuviera en mi casa. Desde que me fui, nunca lo extrañé y por eso no quiero volver. Últimamente estoy llorando mucho porque siento como que está comenzando mi segundo exilio.
Chinelo ¿Cómo es tu relación con el placer, el tiempo libre y el descanso?
Naike Mi relación con el placer, el tiempo libre y el descanso es la misma, porque para mí son una sola cosa. Son esos momentos vividos en los que disfruto del sol sobre mi rostro, por ejemplo. Es placer, tiempo libre y descanso a la vez.
Placer: Es el espacio al que siempre voy, casi siempre como refugio donde puedo celebrarme a mí mismx. Me reservo el poder y el derecho de hacer mucho ruido o nada de ruido cuando disfruto del placer que siento — de todo el placer en el que me deleito en abundancia, viciosamente, que incluye el placer de la soledad y el silencio pero no se limita a eso.
Tiempo libre: andar en bicicleta, ir a festivales de música, comer, descubrir vinos, bailar las danzas vudús tradicionales de Haití son algunas de las muchas opciones que se me ocurren en este momento.
Descanso: Para eso vivo. Como persona que sobresale en su trabajo y que está literalmente enamorada de él, es una paradoja lo haraganx que soy. Nadie lo sabe porque lo que todo el mundo ve es una persona que trabaja muchísimo y es muy exitosa. No saben que puedo ser inflexible en cuanto a disfrutar profundamente de no hacer nada.
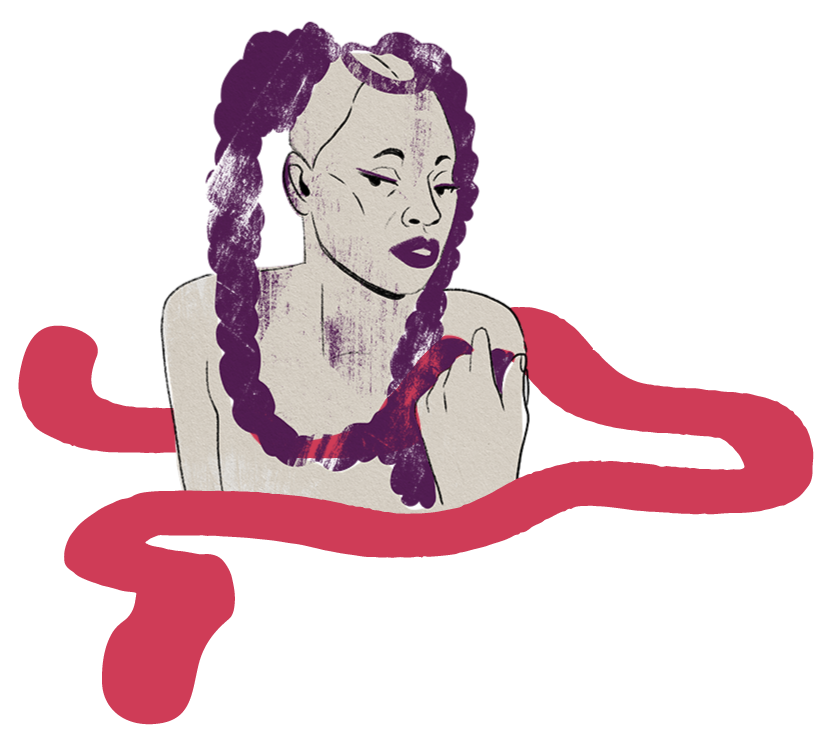
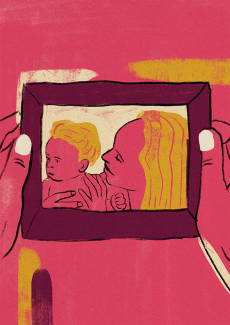
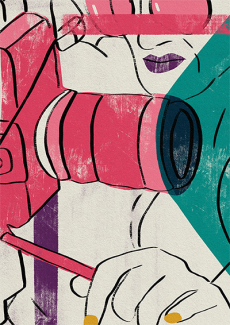
ExplorarCorporalidades Transnacionales
Esta edición en alianza con Kohl: una publicación para Body and Gender Research analizará soluciones, propuestas y realidades feministas para transformar nuestro mundo actual, nuestros cuerpos y nuestras sexualidades.
نصدر النسخة هذه من المجلة بالشراكة مع «كحل: مجلة لأبحاث الجسد والجندر»، وسنستكشف عبرها الحلول والاقتراحات وأنواع الواقع النسوية لتغيير عالمنا الحالي وكذلك أجسادنا وجنسانياتنا.
María Cecilia dedicó la mayor parte de su vida a la incorporación de una perspectiva feminista y de género en el trabajo institucional y organizacional y en el de capacitación.
De niña, demostraba fuerte interés en el arte, la comunicación, la naturaleza, la literatura y el logro de la justicia, especialmente para las mujeres y los grupos marginados.
Estaba comprometida con los derechos sexuales y reproductivos y fue parte de la Junta Nacional para la Educación Integral en Sexualidad. Sus seres queridxs la recuerdan como «una luchadora apasionada e incansable» con un profundo compromiso con los derechos de las mujeres y lxs niñxs.
Snippet - That Feminist Fire Logo (ES)
FRMag - Ashawo Work na Work
"Ashawo Work na Work": Cómo lxs jóvenes feministas de Ghana están haciendo realidad los futuros feministas
por Fatima B. Derby
En 2017, la campaña de AWID #PracticaSolidaridad destacó cómo lxs jóvenes feministas podían construir un futuro feminista apoyándose mutuamente, participando en conversaciones interregionales entre ellxs, marchando en solidaridad con otrxs activistas y abriendo canales de colaboración entre los movimientos. (...)
< arte: «Let it Grow» [Déjalo crecer], Gucora Andu
Clone of Corporalidades Transnacionales | Nota de lxs editorxs
Sin palabras
Chinelo Onwualu
Ghiwa Sayegh
«Cuando estamos desesperadxs por el cambio, como sucede tanto en la enfermedad como en la insurrección, nuestro lenguaje se vacía de complejidad, se queda con sus componentes más esenciales… Sin embargo, a medida que la enfermedad y la revolución persisten, el lenguaje que se hizo en ellas y sobre ellas se profundiza, admite más matices, inmerso en la aguda experiencia humana de encontrar los propios límites en el lugar del fin del mundo».
Cuando comenzamos a delinear este número con Nana Darkoa, antes de Crear | Résister | Transform: un festival para movimientos feministas! de AWID, partimos de una pregunta que es más bien una observación sobre el estado del mundo, un deseo de cambiar el terreno: ¿por qué nuestras sexualidades y placeres siguen siendo domesticados y criminalizados incluso cuando nos dicen, una y otra vez, que no tienen valor ni contribuyen al progreso? Llegamos a la conclusión de que cuando se corporizan, hay algo en nuestras sexualidades que opera contra un orden del mundo que sigue manifestándose en los controles fronterizos, los apartheids en relación a las vacunas, el colonialismo de asentamiento, la limpieza étnica, y el capitalismo descontrolado. ¿Podemos hablar, entonces, del potencial disruptivo de nuestras sexualidades? ¿Podemos seguir haciendo eso cuando, para poder obtener recursos, nuestros movimientos deben ser cooptados e institucionalizados?
Cuando el trabajo de nuestros cuerpos se convierte en ganancias en las manos de los sistemas que buscamos desmantelar, no sorprende que nuestras sexualidades y placeres queden relegados una vez más a las márgenes, especialmente cuando no son lo suficientemente rentables. En muchos momentos durante la producción de este número, nos preguntamos qué sucedería si nos negáramos a dar cabida a los servicios esenciales del capitalismo. Pero ¿podemos atrevernos a hacer esa pregunta cuando estamos agotadxs por el mundo? Quizás nuestras sexualidades son desestimadas con tanta facilidad porque no son vistas como formas de cuidado. Quizás lo que necesitemos sea reimaginar el placer como una forma radical de cuidado, una que también es anticapitalista y anti-institucional.
Estamos entrando en nuestro segundo año completo de pandemia global y nuestro abordaje de la corporalidad transnacional ha tenido que concentrarse en un único descubrimiento político: que cuidar es una forma de habitar la corporalidad. Y como ahora tanto de nuestro trabajo se hace sin tomar en cuenta los límites entre y dentro de nosotrxs, todxs somos Corporalidades Transnacionales, y eso a todxs nos sale mal. Estamos fallando en cuanto a cuidarnos y, lo que es más grave, en cuidar a lxs otrxs.
Ese fracaso no es producto de nuestras acciones.
Muchxs de nuestras madres y padres pensaban que el trabajo era transaccional, algo que debía darse a cambio de una compensación y una garantía de cuidado. Y si bien ese intercambio no siempre se cumplió, nuestrxs madres y padres no esperaban que su trabajo les diera satisfacción. Para eso tenían su ocio, sus pasatiempos, y sus comunidades. Hoy, nosotrxs, sus hijxs, que hemos sido condicionadxs para pensar en nuestro trabajo como entrelazado con nuestra pasión, no tenemos esas expectativas. Pensamos el trabajo y el ocio como una sola y misma cosa. Para demasiadas personas, el trabajo ha llegado a encarnar todo lo que somos.
Sin embargo, el capitalismo heteropatriarcal no nos valora, ni hablar de que valore nuestro trabajo o nuestras sexualidades. Este es un sistema que solo te exigirá más y más hasta que mueras. Y cuando mueras, te reemplazará por otra persona. Que se espere que estemos en línea todo el día significa que simplemente no podemos tomar distancia del trabajo, ni siquiera cuando queremos hacerlo. Esta comercialización del trabajo, divorciándolo de la persona, ha permeado cada aspecto de nuestras vidas y está siendo perpetuado incluso en los círculos más feministas, más radicales y más revolucionarios.
Las expectativas capitalistas siempre han sido particularmente dañinas para los cuerpos que no se ajustan a su ideal. Y quienes buscan consolidar sus poderes han utilizado la pandemia como una oportunidad para concentrar sus ataques en las mujeres, las minorías sexuales y cualquier otrx a quien subestimen.
Este número especial existe debido a eso y ciertamente a pesar de eso.
Casi todxs lxs colaboradorxs e integrantes del equipo se estaban presionando para ir más allá de su capacidad. Cada una de las colaboraciones fue producida desde un lugar de pasión, pero también de un increíble agotamiento. De una forma muy real, este número encarna el trabajo transnacional y, en el mundo digital en el cual vivimos, todo trabajo se ha convertido en trabajo transnacional. A medida que nos enfrentamos a nuevas fronteras que no han roto un viejo orden sino que lo reifican, experimentamos de primera mano, junto a nuestrxs colaboradorxs, cómo el capitalismo vacía nuestros límites, cómo se hace difícil construir argumentos coherentes, especialmente cuando tenemos una fecha límite para hacerlo. Nos quedamos colectivamente sin palabras, porque nos quedamos sin mundos.
Es precisamente porque nos sentimos perdidxs y solxs en el mundo del capitalismo heteropatriarcal que tenemos que reevaluar y repensar nuestros sistemas de cuidado. En muchos sentidos, hicimos de este número una misión de encontrar placer en el cuidado. Porque se ha vuelto más difícil construir argumentos coherentes, los medios visuales y creativos han pasado al primer plano. Muchas personas que solían escribir se han volcado a estos medios como una vía para producir conocimiento y atravesar la niebla mental que nos ha envuelto a todxs. Trajimos otras voces a este número, además de muchxs a quienes ya escucharon en el Festival, como una manera de abrir nuevas conversaciones y ampliar nuestros horizontes.
Dado que nos roban nuestras palabras, es nuestro deber político seguir encontrando maneras de mantenernos y cuidarnos a nosotrxs mismxs y a lxs otrxs. Muchas de nuestras realidades actuales están tratando de borrarnos y desplazarnos, mientras que siguen explotando nuestro trabajo. Nuestra corporización, por lo tanto, se convierte en una forma de resistencia; es el comienzo de que encontremos nuestro camino hacia afuera y hacia nosotrxs mismxs.
Philosophe féministe radicale, Peni était aussi poète, écrivaine, dramaturge et compositrice.
Première coordinatrice du Fiji Women’s Rights Movement (Mouvement pour les droits des femmes aux Fidji), elle a laissé un héritage empreint de sa profonde préoccupation pour les droits fondamentaux des femmes, la justice et la paix. L’engagement de Peni en faveur de la justice sociale, économique et écologique et son travail remarquable lui a valu le respect de la communauté locale et internationale. Au sein des mouvements féministes traditionnels des Fidji, elle a été l’une des premières à travailler avec et aux côtés des personnes LGBTQI et a fourni une assistance concrète au mouvement des travailleurs et des travailleuses du sexe lorsqu’il s’est constitué aux Fidji.
Ses collègues l'ont décrite comme une personne formidable et une leader visionnaire du changement. Elle a inspiré beaucoup de personnes par sa créativité et son courage. Son travail a permis à de nombreuses personnes de se faire entendre, d’acquérir de nouvelles compétences et d’ouvrir de nouvelles voies, tant au niveau personnel que communautaire.
 - 610x470")